

WHERE ADVANTAGE IS MOVING
How the Hormuz disruption is changing the value of routes, capabilities and relationships—and where durable insurance opportunity may be forming.
Update — 3 August 2026: De-escalation signals over the weekend pushed oil prices lower and improved expectations of a near-term settlement. Shipping access, insurance availability and the commercial usability of alternative routes remain unsettled; the distinction between recovered volume and recovered resilience therefore still holds. [27]
On 28 February 2026, one of the world’s most important energy routes begins to disappear from the screen.
In an energy-market control room, the change is visible first in the flow. The heavily travelled line through Hormuz contracts as tanker movements fall and Gulf production becomes harder to reach. As the timeline accelerates, the rest of the map begins to respond: more crude moves west towards Yanbu and through Fujairah, Atlantic cargoes turn towards new buyers, emergency stocks enter the market, and refineries alter what they process and produce.
By June, the main screen looks more reassuring. Total Gulf exports have recovered to 16.1 million barrels a day and the system appears to be doing what resilient markets do—finding capacity, redirecting supply and adapting under pressure.
Yet the market has not rebuilt the system that existed before 28 February. It has built a different one.
Routes that were previously secondary now carry greater strategic weight. Storage, refining flexibility, commercial access and independent logistics have become more valuable, while new dependencies have formed around pipelines, terminals, vessels, insurance capacity and the security of alternative corridors. When pressure later moves towards the Red Sea, the screens reveal that one of the most important workarounds remains connected to the same wider conflict system.
From an insurer’s perspective, this reorganisation is not only a story about loss. It is also a movement of value. Infrastructure, services and relationships capable of solving the newly visible constraints may attract investment, new demand and different forms of insurance—provided they create genuine additional capacity rather than relocating the original vulnerability.
This paper follows where that advantage is moving, which opportunities may endure after crisis pricing subsides, and how insurers can participate without mistaking apparent diversification for a stronger system.
What an executive needs to understand now
| Executive question | Answer in one paragraph |
|---|---|
| What happened? | From 28 February, attacks, vessel risk and tightening insurance availability cut Hormuz flows and forced production shut-ins. Emergency stocks, demand reduction and bypass routes restored part of the volume; renewed July threats then exposed the Red Sea leg of the workaround. |
| What has the market done? | It repriced immediately visible scarcity—oil, freight, hull-war cover and available route capacity—while capital and policy moved towards storage, bypasses, refining and local supply. |
| Where is the disconnect? | June export recovery created a better volume picture, but July exposed shared failure paths. Headline crude availability can also obscure product, location, quality and working-capital constraints. |
| What could still hit the portfolio? | A dual-route disruption, refined-product shortage, insurer service-provider failure, trade-credit strain or government intervention could connect exposures that appear separate in underwriting files. |
| Where is the opportunity? | In capabilities that remain useful after the crisis premium fades: independent logistics, accessible storage, product flexibility, portfolio intelligence, disciplined specialty capacity and resilience advice. |
1. What the market has done
Before the war, roughly 20 million barrels of oil a day moved through the Strait of Hormuz—about one-fifth of global petroleum liquids consumption and more than one-quarter of seaborne oil trade. Around one-fifth of global LNG trade used the same corridor, with Asia receiving most of it. The physical passage was narrow; the commercial assumption built around its continuing use was global. [2],[6]
That assumption failed on 28 February 2026. Between March and May, oil flows through the Strait averaged 2.7 million barrels a day. Cumulative Middle East supply losses exceeded 1.3 billion barrels, North Sea Dated crude reached US$144 a barrel and production shut-ins peaked at an estimated 11.2 million barrels a day in May. The first phase was not an abstract geopolitical premium; it was a loss of physical flow, amplified by vessel risk, insurance availability and uncertainty over duration. [1],[7]
The response was a portfolio, not a replacement. IEA members approved a 400 million barrel emergency release, with 2.5 million barrels a day reaching the market in May. Chinese crude imports fell by 4.6 million barrels a day between February and May. Saudi exports through Yanbu rose from about 2 million to more than 5 million barrels a day, while UAE exports through the Fujairah system increased from 1.9 million to 4.3 million. Atlantic Basin crude exports rose by 3.5 million barrels a day; US crude and product exports reached a record 13.1 million barrels a day in May; West African jet-fuel exports almost doubled. [1],[8],[9]
How the system absorbed part of the gap
By June, total Gulf oil exports, including bypass volumes, had recovered to 16.1 million barrels a day. That was a powerful adjustment from the crisis low, but it remained below the pre-war average of 24 million. The market therefore rewarded what was already activatable: spare transport capacity, stored product, refining flexibility and export systems outside the blocked corridor. It penalised delay, route concentration and any operating model that needed perfect coordination before it could move. [1],[10]
A ROUTE RISK BECOMES A COMMERCIAL RISK
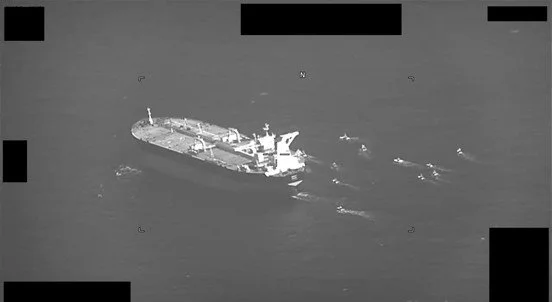
Iranian fast-attack craft approach the Panama-flagged oil tanker Niovi in the Strait of Hormuz, 3 May 2023. The image predates the 2026 disruption; it shows how quickly route risk can become an operating and insurability event.
Image: NAVCENT Public Affairs / U.S. Navy via DVIDS. Public domain.
Insurance repriced on an even shorter clock. By late July, Marsh reported some Hormuz hull-war quotes at 3% to 10% of vessel value after renewed attacks. On a US$100 million vessel, that implies US$3 million to US$10 million for the quoted short-period risk. In the southern Red Sea, reported rates moved from about 0.3% to more than 1%, with some voyages quoted at 3%. Quote validity could fall to 24 hours and policy duration to seven days. The price says capacity is scarce; it does not prove the risk is well understood or that the margin will survive aggregation, reinsurance and claims uncertainty. [5],[11]
2. The disconnect: volume recovered before confidence did
A market can clear without becoming resilient. Higher prices suppress demand, attract distant supply and justify extraordinary logistics. Stocks can bridge a gap. None of those responses means the original dependency has disappeared, and each brings a different exhaustion point. Demand destruction is lost activity as well as conservation; emergency stocks are finite; distant supply adds time and working capital; a bypass can inherit the conflict surrounding the route it was designed to avoid. [1],[14]
The July Red Sea development is the clearest illustration. Yanbu bypassed Hormuz physically, yet some Yanbu-loaded tankers altered course or waited for instructions after Houthi threats. The alternative was geographically different but remained exposed to the same conflict system, shipping market and insurability constraints. Counting lines on a map overstated the independence of the response. [3],[5],[15]
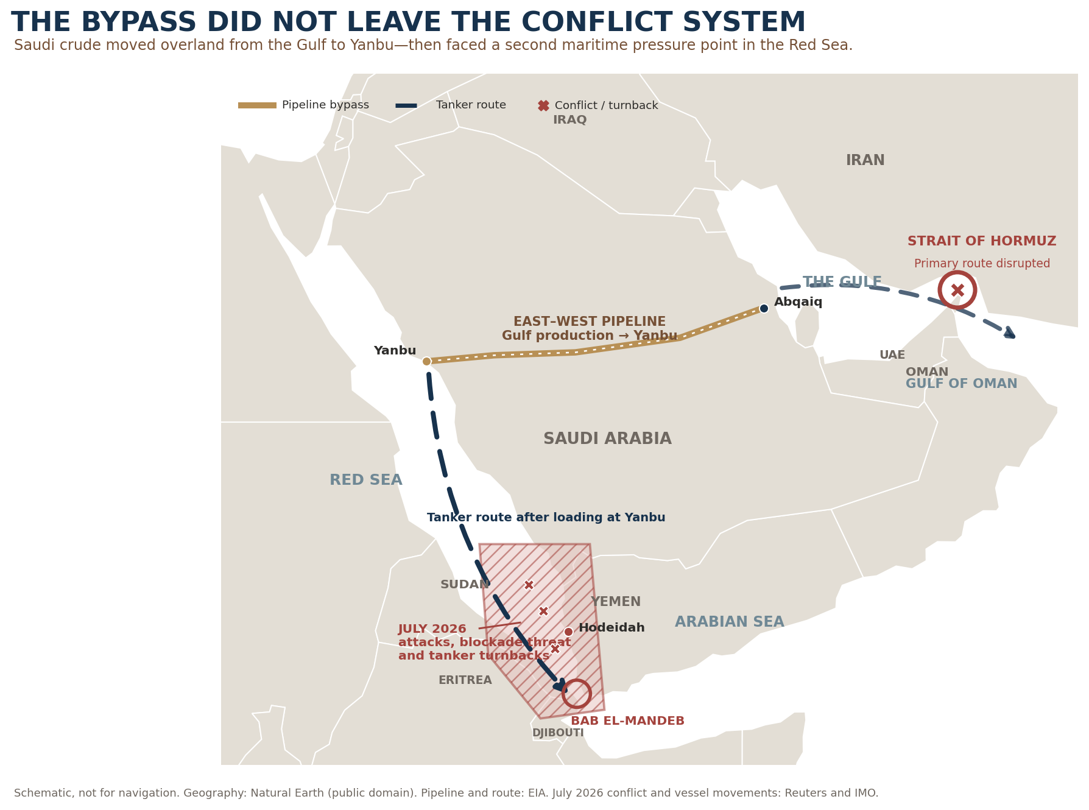
The Saudi East–West pipeline shifted crude from Gulf production to Yanbu, avoiding Hormuz. Loaded tankers still needed to move through a Red Sea corridor later affected by attacks, a blockade threat and vessel turnbacks. Schematic; not for navigation. [2],[3],[5],[15],[16]
Map: Solaris synthesis using Natural Earth, EIA, Reuters and IMO evidence.
| What the headline shows | What may still be hidden | Question to ask |
|---|---|---|
| Gulf exports recovered to 16.1 mb/d | The route mix changed, and an important bypass shared a wider conflict path. | How much recovered capacity survives a simultaneous Red Sea constraint? |
| Crude is available at a price | The required diesel, jet fuel or feedstock may be in the wrong location or fail local quality specifications. | Are we measuring barrels, or usable product at the point of need? |
| War-risk premium has increased | Premium may not capture trapped-vessel aggregation, cancellation, reinsurance or claims-management risk. | What loss concentration sits behind the apparently attractive rate? |
| A new terminal or reserve is announced | Permitting, contracts, vessel access, staffing and distribution determine when it becomes operational. | Which capability exists now, which is committed, and which remains aspirational? |
| Inventory meets a formal obligation | Stock may not be accessible by region, grade, vessel, port or commercial right when needed. | How many days of deliverable product do we have under the scenario? |
INSURER DECISION TOOL
Three tests for any backup
Use these tests before granting diversification credit, expanding appetite or accepting a higher concentration around an insured’s contingency.
Can it operate when the primary route, facility or supplier fails?
Look for: a distinct route, port, utilities, staffing and equipment.
Are vessels, insurance, finance, contracts, specifications and permissions actually available?
Look for: named capacity, binding rights and acceptable terms.
Can it be activated inside the decision window—before scarce capacity is allocated?
Look for: an owner, authority, trigger, lead time and a tested process.
3. What could still hit the portfolio
The obvious loss is a vessel, cargo or facility in the affected geography. The more difficult accumulation sits in what many insureds, borrowers and service providers require in common. Fuel, shipping, trade finance, specialist labour, cloud infrastructure, sanctions screening and regulatory permission can connect risks that are separated by industry, country and policy class. The underwriting file shows the insured. The accumulation sits in what many insureds have in common.
Scenario imagery | Not forecasts
| Scene | What unfolds | Portfolio consequence |
|---|---|---|
| The usable-product squeeze | A tanker arrives, but not with the grade or product the region needs. Crude inventories look adequate while diesel, jet fuel or a refinery feedstock becomes scarce. Airlines adjust schedules, mines defer maintenance, agricultural contractors compete for supply and distributors extend credit to retain customers. | Business interruption without damage, machinery stress, credit deterioration, conduct pressure and political intervention. |
| The dual-route shock | Hormuz flow remains constrained as the Red Sea becomes harder to insure. Vessels reroute, war-risk and freight charges rise together, and the voyage length consumes more working capital and available tonnage. | Marine aggregation, cargo delay, contingent BI, aviation and transport cost, trade credit and liquidity pressure. |
| The insurer’s own dependency | Claims volume rises just as an offshore service provider, payment rail, repair network or specialist supplier is disrupted. The insurer can accept the risk financially but cannot perform the promised service at speed. | Operational resilience, outsourcing, complaints, claims leakage, regulatory attention and reputational harm. |
An economically significant dependency does not automatically produce a responsive insurance claim. ANZIIF’s examination of industrial special risks points to Australian businesses affected by the 2011 Thailand floods whose exposure to overseas suppliers had been contemplated, but whose policies did not cover flood damage to the suppliers’ premises and stock. Without the relevant material-damage trigger, the business-interruption section did not respond.[26]
The same discipline should be applied to the alternatives emerging from the current disruption. Before an insurer treats a new supplier, route or storage arrangement as evidence of protected diversification, it needs to understand the relevant location, peril, policy trigger, sublimit, waiting period and indemnity period. Otherwise, the portfolio may contain a commercially critical dependency that is either uninsured or protected very differently from what the business assumes.
A rigorous review must therefore trace the shock into revenue, cost, behaviour and operational stress, and then separately test causation, physical-damage requirements, exclusions, sublimits, waiting periods, aggregation language and any available non-damage cover. The purpose is to understand how the portfolio may behave before claims provide the answer.
4. Where advantage is moving
The early beneficiaries did not invent new resources after the disruption. They activated capabilities that already existed. Yanbu exports rose from about 2 million to more than 5 million barrels a day; UAE exports through Fujairah rose from 1.9 million to 4.3 million. Atlantic Basin suppliers increased exports. US crude and product exports reached a record 13.1 million barrels a day in May. Nigeria's Dangote refinery became more important to African and European buyers and processed above its 650,000 barrel-a-day nameplate during a June test. [1],[8],[9],[17]
The gain is a split screen, not an unqualified success story. Nigeria's refinery became more valuable to regional and European buyers while domestic users faced higher prices and supply pressure. UN Trade and Development identified 61 economies exposed to combined oil and cereal import shocks. A profitable asset can therefore sit beside deteriorating household welfare, sovereign pressure and trade-credit risk. Opportunity analysis that ignores the other side of that screen will misread both the market and the portfolio. [17],[18],[19]
The lesson is not simply to buy whatever rose during the crisis. Crisis pricing can disappear long before new capacity earns back its cost. The stronger opportunity lies in capabilities that solve a persistent constraint: independent route access, storage that can actually be drawn, flexible processing, product compatibility, strong commercial rights and decision systems that act while options still exist. Resources get attention, but it’s the capability to operationalise those resources that brings the money.
| Opportunity area | Why demand may persist | What must be true | Insurance / advisory implication |
|---|---|---|---|
| Independent logistics and ports | Shippers will pay for route optionality after a visible shared-path failure. | The route must avoid the same conflict, vessel, insurance and approval constraints. | Marine, cargo and political-risk capacity paired with live aggregation intelligence. |
| Accessible storage | Buyers value time when supply is volatile and product is location-specific. | Inventory must be the right grade, contractually available and distributable. | Property, BI, stock, liability and resilience advice tied to drawdown scenarios. |
| Refining and product flexibility | Product scarcity can outlast crude scarcity and redirect regional trade. | Feedstock fit, maintenance, environmental rules and offtake economics must hold. | Engineering, machinery, environmental and supply-chain risk services. |
| Portfolio dependency intelligence | Boards and regulators increasingly expect evidence that external shocks enter decisions. | Data must connect common dependencies to exposure, wording, limits and actions. | A scalable capability for insurers, brokers, MGAs and large corporates. |
| Trade-credit and supply-chain solutions | Working-capital and counterparty stress emerge before physical loss in many sectors. | Underwriting must distinguish temporary liquidity stress from structural deterioration. | Selective growth with sector triggers, concentration limits and client diagnostics. |
| Client resilience services | Executives need decisions and evidence, not another geopolitical watchlist. | Advice must link scenarios to operations, finance, insurance and named owners. | Deeper client relevance, better risk selection and earlier renewal conversations. |
For insurers, specialist war-risk pricing may offer attractive revenue, but only where accumulation, trapped vessels, quote duration, cancellation, reinsurance and claims response are understood. The more durable investment is the intelligence beneath the price: the ability to see route concentration across a portfolio, recognise when the evidence has changed and move appetite before loss experience makes the decision unavoidable. [5],[11],[12],[13],[20]
5. Australia: the exposure, the choices and the opening
Australia is resource-rich and system-dependent. Its immediate vulnerability enters through refined products and Asian refining, as well as shipping, currency and product availability. March-quarter 2026 Minimum Stockholding Obligation statistics equated industry holdings to 37 days of petrol, 30 days of jet fuel and 32 days of diesel. These figures are not directly comparable with the IEA's 90-day net-import obligation, and the Australian measure is volume-based. They nevertheless show that the operating window for essential fuels was measured in weeks, not seasons. [21],[22]
The correct question is not whether Australia was about to run out. It is how much decision time remained once vessel access, port capacity, product grade, regional distribution and commercial rights were applied. A national stock number can coexist with a local shortage, a mismatched fuel grade or a delay severe enough to alter aviation, mining, agriculture, freight and emergency-service operations.
AUSTRALIAN CHOICES LEAVE PHYSICAL CONSEQUENCES
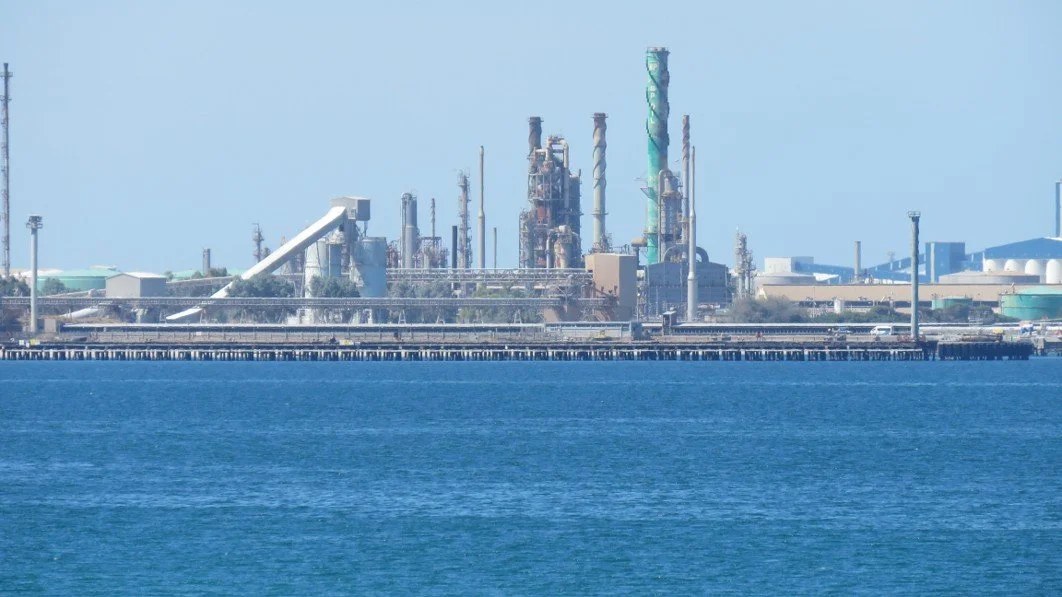
The derelict BHP Jetty Number 1 at Kwinana Beach, with the former BP Kwinana refinery in the background, December 2023. Infrastructure choices made during stability shape the options available in a crisis.
Image: Calistemon / Wikimedia Commons. CC BY-SA 4.0. Unmodified.
Government measures recognised that exposure. They included a A$7.5 billion Fuel and Fertiliser Security Facility, a A$3.2 billion Australian Fuel Security Reserve, a 50-day diesel and jet-fuel target, refining feasibility work and temporary changes to stockholding and fuel-quality settings. Those decisions expand the option set. They also create new questions about delivery dates, asset economics, environmental trade-offs, access rights and how public support will interact with private capital. [22],[23],[24]
For insurers and investors, the opening is not a broad bet on self-sufficiency. It is selective support for capabilities that reduce a demonstrated constraint: storage linked to distribution, flexible processing, port and pipeline reliability, fertiliser continuity, risk-engineered logistics and data that shows whether product is genuinely available. The opportunity is strongest where public policy, customer demand, commercial access and operational readiness reinforce one another.
The scenarios should be designed around the consequence that must be managed, rather than an attempt to predict every possible cause. Loss of fuel access, vessel capacity or a critical supplier could arise through military action, sanctions, cyber disruption, port closure, regulatory intervention, physical damage or the withdrawal of insurance.
The useful rehearsal therefore tests when an external development has moved beyond a routine operational problem and become a portfolio-level issue requiring coordinated decisions. It should establish who is authorised to escalate the response, what information must be shared across underwriting, claims, reinsurance, risk, investment and operations, and which actions can be taken before complete certainty is available.
Three Australian scenarios to rehearse
| Scenario | What executives see first | Portfolio question | Decision before the event |
|---|---|---|---|
| Two-week product squeeze | Freight and war-risk costs jump; distributors protect key customers; aviation and heavy transport seek priority supply. | Which insureds fail through working capital, contract penalty or unsafe substitution before physical damage occurs? | Set sector watchlists, claims signals, credit triggers and client outreach. |
| Six-week dual-route disruption | Hormuz and Red Sea constraints overlap; voyage times lengthen; jet fuel and diesel become the operating concern. | Where do marine, aviation, mining, agriculture, property and trade credit share the same fuel dependency? | Aggregate across lines; test reinsurance, limits, referral and operational readiness. |
| Twelve-month structural reset | Government and industry commit to storage, processing, standards flexibility and longer-term supply contracts. | Which capabilities retain value if spot prices normalise, and which depend on permanent crisis pricing? | Back projects with demand, access and policy durability; avoid announced capacity without an activation path. |
APRA has made the governance expectation explicit. Its 17 June letter expects boards to satisfy themselves that geopolitical risk is reflected in strategy, risk appetite and oversight; that material gaps have owners and timelines; and that reporting covers financial and non-financial exposures, offshore dependencies and service-provider vulnerabilities. Targeted readiness assessments are planned across larger banking, insurance and superannuation entities in 2026–27. A geopolitical watchlist is therefore not evidence of readiness. The institution must be able to show how the external event enters a decision. [25]
6. The executive agenda
The immediate task is to turn the external event into a small number of decisions with owners and evidence thresholds. The questions below are designed to be used verbatim in a board, risk, underwriting, investment or portfolio meeting.
Ask where the exposure is shared. “Which ten external dependencies connect the largest number of our insureds, suppliers and internal operations?”
Challenge the backup. “Are we counting geographic diversity, or genuine physical, commercial and decision independence?”
Separate crude from usable product. “Do our assumptions measure headline supply, or the grade and product deliverable at the point of need?”
Find the uninsured pathway. “Which economic stresses will change behaviour, credit quality or claim severity even if they do not trigger cover directly?”
Expose the cross-line accumulation. “Where could marine, property, aviation, agriculture, casualty and credit respond to the same dependency on different clocks?”
Name the decision trigger. “What observable evidence would change appetite, limits, reinsurance, claims readiness or investment?”
Test the opportunity after normalisation. “Would this capability still solve a valuable problem if spot prices and war-risk premium fell sharply?”
A trigger sheet for management
| Signal | Evidence to watch | Decision threshold | Management response |
|---|---|---|---|
| Physical flow | Strait and bypass throughput; product-level inventories; port and pipeline availability. | Flows recover but product or access remains constrained. | Refresh exposure map; contact high-dependency insureds; review claims staffing. |
| Insurability | War-risk rate, quote validity, cancellation and reinsurance terms. | Price and conditions move together; capacity becomes seven-day or voyage-specific. | Tighten referrals; aggregate vessels and routes; confirm claims and reinsurance response. |
| Shared failure path | Red Sea threats, vessel diversions and alternative-route congestion. | Primary and backup routes deteriorate at the same time. | Remove diversification credit; run the dual-route scenario; revisit limits. |
| Australian operating buffer | Diesel and jet stocks, regional distribution, fuel-quality variations and government measures. | Deliverable days fall faster than formal stock days. | Activate sector watchlists; assess mining, agriculture, aviation and freight concentration. |
The 30-second contribution “The market has replaced part of the lost volume, but it has not restored failure-path independence. Our next step is to map the dependencies shared across the portfolio, test whether the backups are commercially usable, and set the evidence that would change appetite before claims force the answer.”
Capacity on paper versus capacity in practice: A pipeline, storage facility, alternative supplier or contingency arrangement should not be treated as available simply because its capacity has been announced. Test whether it is operating, commercially accessible and capable of delivering the required product to the required location within the required timeframe. Evidence may include actual throughput, vessel movements, inventory releases, utilisation levels, current insurance terms and completed deliveries.
Ways to engage Solaris
Solaris provides flexible, senior support—from a focused independent review or executive session through to longer advisory and implementation work.
01 Strategic advisory
Complex risk and insurance problems, risk appetite, governance and decision quality.
02 Portfolio and product review
Independent portfolio, underwriting, product and insurance-program review and optimisation.
03 Executive briefings and workshops
Board-ready insight, scenario sessions and facilitated decision workshops.
04 Interim and implementation support
Senior specialist leadership, program design and practical implementation support.
Start with the decision, portfolio question or emerging risk that needs greater clarity.
Contact SolarisThe decision advantage
Hormuz did not reveal an unknown waterway. It revealed how much activity had come to depend on one condition remaining usable, insurable and affordable. The market then demonstrated both its adaptability and its limits: emergency stocks, demand reduction, bypass routes, Atlantic supply and refinery changes restored part of the flow, but one of the most important workarounds remained exposed to the same wider conflict system.
For executives, the useful conclusion is neither complacency nor alarm. It is that concentration can sit in an assumption rather than an asset, and that the best opportunities appear where a proven constraint meets a capability that can be activated before scarcity removes choice. Earlier understanding creates better options—provided it is converted into a decision, an owner and a trigger.
Source notes
Observed facts, announced measures and Solaris analysis are kept distinct. Links and material claims were checked to the evidence cut-off of 30 July 2026. Image credits and licences appear on the pages where the images are used and are repeated below.
1. International Energy Agency. How global oil supplies readjusted after the Strait of Hormuz shock
2. U.S. Energy Information Administration. The Strait of Hormuz is the world's most important oil transit chokepoint
3. Reuters. Ships change course in the Red Sea after Houthi threats
4. Reuters. Red Sea shipping slows after Houthi attack on Saudi Arabia, data shows
5. Reuters. War-risk insurance costs surge for southern Red Sea voyages
6. U.S. Energy Information Administration. The Strait of Hormuz is also a major LNG chokepoint
7. U.S. Energy Information Administration. Short-Term Energy Outlook, 2026
8. Reuters. Nigeria's Dangote refinery tops 700,000 barrels a day in test
9. U.S. Energy Information Administration. U.S. crude oil and petroleum product exports reached a record
10. International Energy Agency. Oil Market Report, July 2026
11. Marsh. Strait of Hormuz crisis deepens: war-risk insurance and supply-chain resilience
12. Reuters. War insurers advise some shipowners to pause Hormuz voyages
13. Reuters. Maritime insurance premiums surge as conflict widens
14. International Energy Agency. Executive Director statement on oil markets
15. International Maritime Organization. Statement on attacks in the Red Sea
16. Natural Earth. Natural Earth data
17. Reuters. Middle East shock gives Dangote refinery leverage as cheap imports dry up
18. UN Trade and Development. Strait of Hormuz disruptions: beyond reopening
19. Reuters. Hormuz disruption may have lasting impact on vulnerable economies
20. Allianz Commercial. Safety and Shipping Review
21. Australian Government DCCEEW. Minimum Stockholding Obligation statistics
22. Australian Government DCCEEW. Minimum Stockholding Obligation
23. Australian Government. Securing Australia's fuel supply
24. Australian Government DCCEEW. Regulating fuel quality
25. Australian Prudential Regulation Authority. Strengthening readiness for geopolitical shocks
26. ANZIIF. Tailored cover: industrial special risk. Link the title to ANZIIF.
27. Associated Press. Oil prices slide after new strikes are halted and a possible settlement is signalled. Link it to Associated Press.
Image credits
Image: MODIS Land Rapid Response Team, NASA GSFC. Public domain.
Image: NAVCENT Public Affairs / U.S. Navy via DVIDS. Public domain.
Image: Calistemon / Wikimedia Commons. CC BY-SA 4.0. Unmodified.
Map: Solaris synthesis using Natural Earth, EIA, Reuters and IMO evidence.
About Solaris
Solaris Risk & Insurance Advisory helps insurers and executive leaders identify emerging risks, hidden exposures and strategic opportunities before they become visible through claims or lagging analysis. © 2026 Solaris Risk & Insurance Advisory. General information only; not legal, investment or insurance coverage advice.

.jpg)
