

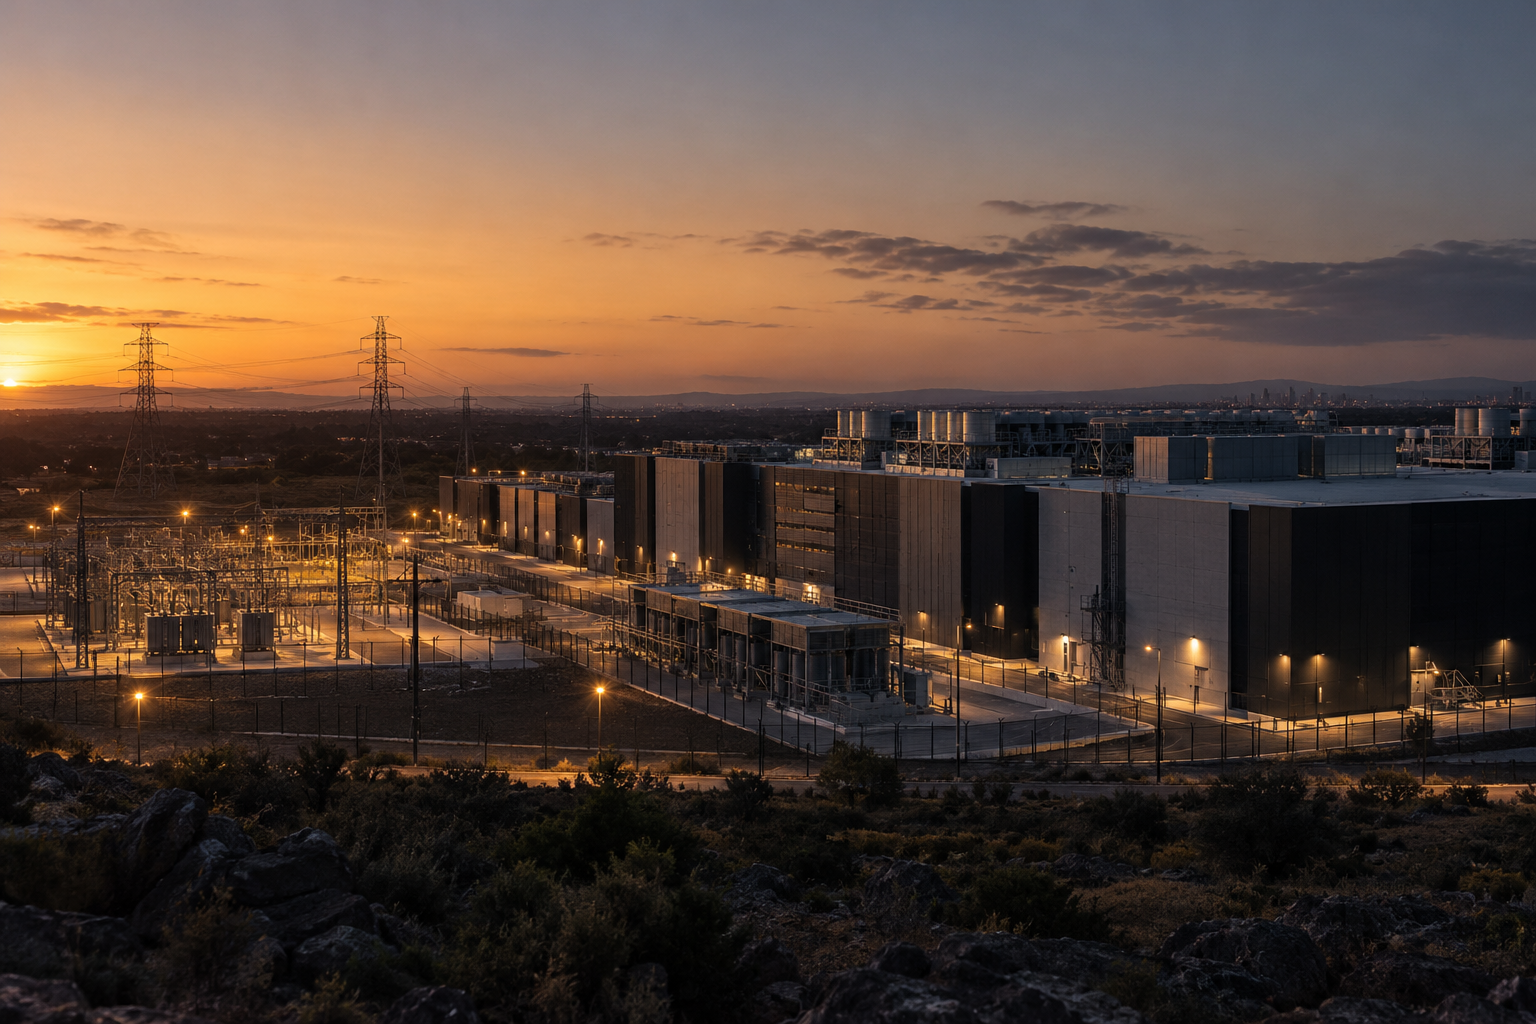
A data centre can be read as a building, a power customer or a critical service. For insurers, it is often all three—across construction and the operating life that follows.
Risk intelligence for insurance executives
Executive summary
Australia’s data-centre expansion offers insurers growth across construction, operating facilities and the businesses supporting them. DC Byte forecasts operating capacity rising from 1.5 GW in March 2026 to about 3.2 GW by 2030, although the much larger development pipeline includes proposals that may never proceed. For Australian insurers, the size and timing of premium growth will depend on project delivery and access to clients’ insurance placements.
As campuses grow, a single event can affect more assets, services and insured businesses. Larger campuses concentrate equipment values and customer services, while shared power, networks and suppliers can expose several sites and insurance classes to the same disruption. Construction delays and commissioning damage can extend project exposure and postpone opening, while operating losses depend heavily on restoration time, customer obligations and resilience to outages, cyberattack, sabotage and terrorism.
The commercial case therefore extends beyond the premium attached to individual campuses. Supporting infrastructure and specialist suppliers may offer routes into the sector that better fit an insurer’s existing capabilities, although these businesses can share the same underlying exposures. Sustainable growth depends on whether pricing and reinsurance support an acceptable return on the combined portfolio, including the loss retained when one event affects several insured customers.
The business question
Almost every time we open a newspaper or news app, there seems to be another data-centre development announced, an expansion planned or a challenge making headlines. As this infrastructure becomes increasingly important to businesses and communities, its growth raises a commercial question for insurers: how much new business could it generate, and what risks would come with it?
Australia’s data-centre expansion is usually described in gigawatts and billions of dollars, but the insurance opportunity depends on what is built, how it is used and where cover is purchased. Construction and operation bring different exposures, while the same clients may generate business across property, engineering, cyber, liability and other lines.
Australia had 1.5 GW of operating data-centre capacity at March 2026, which DC Byte forecasts will reach about 3.2 GW by 2030. The larger development pipeline suggests further potential, although the timing and extent of delivery remain uncertain as projects move towards construction and operation. DC Byte / Data Centres Australia, Australian Data Centre Forecast Report
An illustration based on Australia’s share of global data-centre capacity puts annual Australian premium at around A$230 million today, rising to A$550–680 million by 2030. This gives a sense of possible scale, not a measured Australian premium pool or a risk-based forecast. The calculation and its limitations are set out in the source note. Allianz Commercial, The data centre construction boom · JLL, 2026 Global Data Center Market Outlook
Reading the figures
The development pipeline includes projects that may never be built. The 2030 figures estimate total operating capacity. Australian premium figures are illustrative scenarios, not measured market totals.
What the industry is becoming
Data centres bring together servers, storage and network equipment with the electrical, cooling and security systems that support cloud computing, digital services and artificial-intelligence workloads. Their insurance significance extends beyond the physical assets because an interruption can also affect the businesses relying on those services.
Different businesses. Shared infrastructure.
Illustrative models—not fixed site categories. A campus can combine several uses.
Hyperscale
Large campuses or leased capacity
Cloud platforms and digital services
Insurance lensWho owns the building, servers and service obligation?
Colocation
Shared facilities, multiple customers
Space, power, cooling and connectivity
Insurance lensHow could a shared-system failure affect several tenants?
AI compute
High-performance computing capacity
Access to chips and compute
Insurance lensHow concentrated are equipment values, customers and financing?
Enterprise & edge
Dedicated facilities or smaller local sites
An organisation’s own operations or local users
Insurance lensWhich business activities depend on this site?
Supporting systems and services across these models
Switchgear & transformers
Backup generation & storage
Pumps & pipework
Water supply
Network equipment
Cloud connections
Installation & maintenance
Security & specialist suppliers
Across these business models, asset ownership and service responsibility may sit with different parties. The building owner, equipment owner and operator can therefore have distinct insurance interests and liabilities, even when they share the same site.
Market scale, investment and delivery
The development pipeline is shifting towards larger campuses: of 90 facilities in development, 47 exceed 100 MW, compared with only three of 162 operational facilities. This brings more equipment and customer services within reach of a single loss, while the concentration of around 94% of the all-stage pipeline in NSW and Victoria increases reliance on those states’ infrastructure. Data Centres Australia / DC Byte
Who is building and operating the market
Operators such as AirTrunk, CDC and NEXTDC sit alongside global providers such as Equinix, property developers and hyperscalers that build or lease capacity. These different ownership and leasing arrangements shape who purchases insurance and which assets, earnings and contractual obligations are covered. Data Centres Australia · Equinix
The scale of proposed investment is substantial: NSW reported A$51.4 billion across 20 proposed major projects in July 2026, while Mandala estimates A$42 billion in investment nationally to support projected expansion to 2030. The commercial outlook still depends on customer demand keeping pace with new facilities, since lower occupancy or utilisation would affect operator revenue and insured earnings. NSW Government · Mandala study
Delivery and infrastructure risks
Planning approvals, community opposition, financing and customer commitments can alter a project’s timing or viability, while builder or subcontractor failure can interrupt works and increase completion costs. The financial strength of developers and key contractors is therefore relevant to both completion prospects and the length of construction exposure.
These delays may defer premium, although an insurance claim depends on the cause and policy terms; a financing setback, for example, may leave the developer with an uninsured loss. Commonwealth expectations · NSW framework · Procurement due diligence
Power availability affects both delivery and operating losses. Grid-connection delays can prolong construction exposure and defer operating premium, while an outage after commissioning tests whether backup systems can sustain the required load until supply returns. AEMO’s Step Change scenario projects data centres’ share of National Electricity Market consumption rising from about 3% in 2025–26 to 13% by 2035–36, underscoring the sector’s growing dependence on reliable energy infrastructure. AEMO
Where the insurance opportunity sits
The opportunity has two distinct phases, with project-based construction business giving way to recurring operating premium. Their different loss patterns, coverage requirements and demands on specialist expertise affect the commercial case for participating in either or both.
Construction and commissioning
Premium: Construction business covers the build, equipment installation, testing and commissioning, with premium reflecting the insured project value, scope and period of cover.
Exposure: Damage during works or initial system testing can increase repair costs and delay opening, while longer construction periods extend the time at risk. Delay in start-up (DSU) cover may also respond to lost earnings following insured damage.
Operation
Premium: Operating business generates recurring premium linked to asset and equipment values, utilisation and insured earnings.
Exposure: Equipment failure, fire, water damage, cyberattack, sabotage or terrorism can damage assets or interrupt services, with losses shaped by restoration time, the customers affected and the operator’s contractual obligations.
Protection and cover: Physical security, cyber controls, staff and supplier access, and tested recovery arrangements are central to the assessment of these critical services. The interaction between property, cyber, business interruption and terrorism policies is also significant, particularly where exclusions or gaps leave part of an event uninsured. CISC, critical infrastructure risk management
Adjacent infrastructure and services
Power, cooling, connectivity, equipment suppliers and specialist services broaden the opportunity beyond campus owners and operators. These businesses may fit an insurer’s existing products and broker relationships even where the size or concentration of a campus risk falls outside its appetite.
Growth may come through increased cover on existing policies, although a wider supplier portfolio can still leave several insured businesses exposed to the same campus disruption.
Phased development and changing cover
Large campuses may have construction, commissioning and operation under way simultaneously, so insured values and coverage change as each stage opens. An event affecting completed facilities and unfinished works can involve both DSU and operational business interruption, making the transition between policies a significant feature of phased developments.
Accumulation across the sector portfolio
The same campus or operator may appear across construction, property, cyber, liability and supplier policies, creating multiple claims from one event. The combined portfolio can therefore carry more exposure than individual placements suggest.
Geographic spread offers limited protection where facilities depend on the same power networks, fibre routes, cloud platforms or suppliers. The extent of diversification rests on whether alternative systems can operate independently and whether recovery arrangements have been demonstrated in practice.
Allianz Commercial reports about €700 million in data-centre claims, with fire accounting for more than half the loss severity and water damage the most frequent cause. Business interruption drove the greatest severity by line, while individual hyperscale losses of US$50–100 million illustrate the potential scale. These overseas claims provide context for loss scenarios rather than an estimate of expected Australian claims. Allianz Commercial, claims trends
Capacity, reinsurance and commercial viability
Capacity and reinsurance. The scope for growth depends on how much loss an insurer could retain after reinsurance from an event affecting several policies, classes or customers. That combined exposure, including shared infrastructure and suppliers, determines how additional business fits within risk limits and available capital.
Specialist capability. Data-centre underwriting draws on knowledge of complex systems, reliable information on assets and dependencies, and engineering and claims expertise. The cost and availability of that capability influence the profitability of entry or expansion.
Commercial returns. Project delays, lower insurance prices and losses across several policies can each weaken expected returns, making the resilience of the business case as relevant as the headline premium opportunity.
Assessing the sector opportunity
For established insurers, expansion may deepen existing customer relationships while increasing concentrations already on the books. For new entrants, the prospective premium has to support the expertise, capacity and capital required to participate; in both cases, the commercial assessment turns on five related considerations.
1. The accessible market
The relevant market comprises operating facilities and projects likely to proceed, together with the businesses purchasing their insurance. Local versus overseas placement and access through brokers or other channels determine how much of that premium an Australian insurer could realistically compete for, and when.
2. The scope for participation
Construction, operation and supporting services offer different combinations of premium, risk and expertise. Their fit with the insurer’s capabilities and existing book provides a basis for selecting target customers, limits and exclusions.
3. The combined exposure
An assessment across existing and proposed policies reveals the potential loss from a campus event, operator disruption or shared-infrastructure failure. The amount retained after reinsurance is the relevant measure of how much further growth the portfolio can support.
4. The economics of growth
Expected returns depend on achievable pricing, claims, expenses, reinsurance and capital, including the cost of specialist capability. Scenarios involving slower delivery, weaker pricing or major losses show how sensitive the commercial case is to changing conditions.
5. The conditions for continued growth
The case for expansion evolves as projects reach construction, customers take up capacity and claims experience develops. Agreed measures of pricing, concentration and reinsurance availability provide a basis for reviewing whether participation remains commercially attractive.
Source and currency note
Premium scenario method. The illustration applies Australia’s share of global capacity—1.5 GW against an implied 103 GW base today, and 3.2–3.9 GW against JLL’s 200 GW outlook for 2030—to Allianz Commercial’s global premium estimates of about US$11 billion today and more than US$24 billion by 2030. It assumes premiums move with capacity and does not adjust for local pricing, insurance take-up, policy structure, offshore placements or the different economics of construction and operation. The 2030 range shows how the premium calculation changes when either published capacity estimate is used. The difference between those estimates has not been reconciled; the range does not indicate the probability of a particular outcome. Allianz Commercial, The data centre construction boom · JLL, 2026 Global Data Center Market Outlook
Mandala’s August 2026 study uses 3.9 GW of operating capacity by 2030, also citing DC Byte. The difference from the earlier 3.2 GW forecast has not been reconciled, so the two estimates are used here to illustrate the sensitivity of the premium calculation. Mandala Partners, The Economic Contribution of the Data Centre Industry in Australia, page 13
Australian capacity and pipeline figures are from Data Centres Australia / DC Byte and are current to 31 March 2026. NSW project and connection data are dated July 2026. Local project, investment and economic contribution figures are stated in Australian dollars. Global market and claims figures remain in their source currencies.
The global premium estimate is converted at the Reserve Bank of Australia’s indicative rate on 12 October 2026 of A$1 = US$0.6979, held constant for the 2030 illustration. Reserve Bank of Australia, exchange rates
Economic context. Mandala estimates annual economic contribution from operating data centres and their supply chains rising from A$2.3 billion to A$5.6 billion by 2030. This is not operator revenue or insurance premium. Mandala study
Outage-cost context. Uptime Institute’s 2025 survey found that 54% of respondents’ most recent serious outages cost more than US$100,000, while one in five cost more than US$1 million. These operator-reported costs provide operational context rather than insured-loss estimates. Uptime Institute, Annual Outage Analysis 2025
